Real Estate
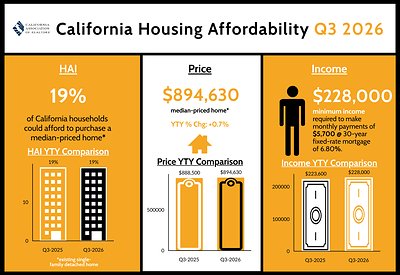
- Nineteen percent of California households could afford to purchase the $894,630 median-priced home in the third quarter of 2026, unchanged from both the second quarter and a year ago.
- A minimum annual income of $228,000 was needed to make monthly payments of $5,700, including principal, interest, taxes and insurance, as the effective 30-year fixed mortgage rate rose to 6.80 percent.
- Thirty-one percent of California households could afford the $640,000 median-priced condo or townhome, up from 30 percent in both the previous quarter and a year ago.
SACRAMENTO, Calif., Oct. 30, 2026 /PRNewswire/ — California housing affordability held steady in the third quarter of 2026 as lower home prices helped offset higher mortgage rates and kept monthly housing costs unchanged from the previous quarter, the CALIFORNIA ASSOCIATION OF REALTORS® (C.A.R.) said today.
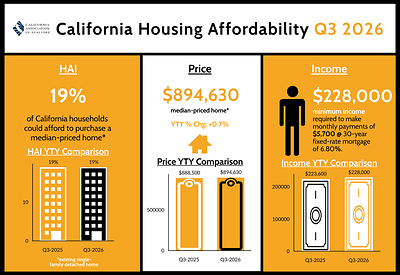
Nineteen percent of the state’s households could afford to purchase a median-priced, existing single-family home in California in third-quarter 2026, unchanged from both the second quarter of 2026 and the third quarter of 2025, according to C.A.R.’s Traditional Housing Affordability Index (HAI).
Despite the quarterly stability, affordability remained challenging as mortgage rates climbed and home prices stayed elevated. With inflation likely to remain high in the near term, mortgage rates may not moderate much over the next couple of months, continuing to constrain purchasing power for prospective homebuyers.
C.A.R.’s HAI measures the percentage of all households that can afford to purchase a median-priced single-family home in California. C.A.R. also reports affordability indices for regions and select counties within the state. The index is considered a fundamental measure of housing well-being for home buyers in California.
Mortgage rates increased for the second consecutive quarter in the third quarter of 2026, adding to the financial challenges facing prospective homebuyers. The effective 30-year fixed mortgage rate rose to 6.80 percent, up from 6.54 percent in the second quarter and 6.67 percent in third-quarter 2025, reaching its highest level since the second quarter of 2025. After declining for four consecutive quarters through early 2026, borrowing costs have reversed course amid persistent inflation concerns and continued economic uncertainty. Elevated mortgage rates could weigh on housing demand and affordability in the months ahead.
California’s median home price declined in the third quarter after reaching a new record high during the spring homebuying season. The statewide median price for an existing single-family home fell 2.3 percent, from $915,590 in the second quarter to $894,630 in the third quarter but remained 0.7 percent above its year-ago level. The quarterly decline was broadly consistent with recent seasonal trends, although slightly larger than the 2.1 percent decrease recorded during the same period last year.
Home prices could soften further as the market enters its traditional slow season, particularly if higher mortgage rates continue to dampen housing demand. Historically, the statewide median price has declined an average of 1.5 percent from the third to the fourth quarter. Additional price moderation could offset some of the increase in borrowing costs due to higher mortgage rates and help California housing affordability improve in the coming quarter.
The minimum qualifying household income needed to purchase a median-priced existing single-family home remained at $228,000 in the third quarter, unchanged from the previous quarter but was $4,400 higher than a year ago. The corresponding monthly mortgage payment, including principal, interest, taxes and insurance (PITI), also held steady at $5,700, although it increased 2.0 percent from third-quarter 2025. The income required to purchase a typical California home has now exceeded $200,000 in 15 of the past 16 quarters. California’s monthly housing payment also remained more than twice the national average of $2,760.
Housing affordability for condominiums and townhomes improved modestly in the third quarter, helped by lower prices and higher household income. The share of households able to afford a median-priced condo or townhome increased to 31 percent, up from 30 percent in both the previous quarter and a year ago. The statewide median condo/townhome price declined 4.5 percent from the previous quarter and 1.5 percent from a year ago to $640,000. The minimum qualifying household income fell $3,600 from the second quarter to $163,200, while the corresponding monthly mortgage payment declined 2.2 percent quarter over quarter.
Key points from C.A.R.’s third-quarter 2026 Housing Affordability report include:
- Affordability varied considerably across California. Of the 53 counties tracked by C.A.R., 24 posted quarter-to-quarter improvements in their Housing Affordability Index, while affordability declined in 21 counties and was unchanged in eight. On a year-over-year basis, affordability improved in 28 counties, declined in 18 and was unchanged in seven. Moderating home prices helped ease some of the pressure from higher borrowing costs in several local markets.
- Lassen remained California’s most affordable county, with 61 percent of households able to afford a median-priced home, followed by Trinity at 43 percent and Tuolumne at 42 percent. Lassen also had the state’s lowest minimum qualifying household income at $56,000, based on a median home price of $220,000 and an estimated monthly housing payment of $1,400. Lassen and Trinity were the only two counties with median home prices below $300,000 and monthly housing payments below $2,000.
- Mono remained the state’s least affordable county at 8 percent, followed by Santa Barbara at 12 percent and Monterey at 13 percent. Homebuyers in all three counties needed a minimum qualifying household income of at least $239,200 to purchase a median-priced home.
- San Mateo continued to have the highest income requirement in California, with buyers needing a minimum qualifying household income of $578,400. San Mateo and San Francisco, at $509,600, were the only two counties where buyers needed annual household incomes exceeding $500,000 to qualify for a median-priced home.
- Affordability improved from a year ago in more than half of California’s counties despite higher mortgage rates. Lake County recorded the largest year-over-year increase, gaining 15 percentage points, followed by Mariposa at 11 points and Lassen and Trinity at nine points each. Among counties where affordability declined, Plumas posted the largest decrease at eight percentage points, followed by Kings and Mendocino, which each declined six points.
See C.A.R.’s historical housing affordability data.
See first-time buyer housing affordability data.
Leading the way…® in California real estate, the CALIFORNIA ASSOCIATION OF REALTORS® (C.A.R.) is one of the largest state trade organizations in the United States, dedicated to the advancement of professionalism in real estate.
CALIFORNIA ASSOCIATION OF REALTORS®
Traditional Housing Affordability Index
Third Quarter 2026
|
3rd Qtr. 2026 |
C.A.R. Traditional Housing Affordability Index |
|||||||
|
STATE/REGION/COUNTY |
3Qtr. 2026 |
2Qtr. 2026 |
3Qtr. 2025 |
Median |
Monthly |
Minimum |
||
|
Calif. Single-family homes |
19 |
19 |
19 |
r |
$894,630 |
$5,700 |
$228,000 |
|
|
Calif. Condo/Townhomes |
31 |
30 |
30 |
r |
$640,000 |
$4,080 |
$163,200 |
|
|
Los Angeles Metro Area |
18 |
17 |
16 |
$847,030 |
$5,390 |
$215,600 |
||
|
Inland Empire |
26 |
25 |
23 |
$600,000 |
$3,820 |
$152,800 |
||
|
San Francisco Bay Area |
24 |
22 |
22 |
$1,300,000 |
$8,280 |
$331,200 |
||
|
United States |
39 |
40 |
39 |
r |
$432,900 |
$2,760 |
$110,400 |
|
|
San Francisco Bay Area |
||||||||
|
Alameda |
23 |
22 |
23 |
r |
$1,274,500 |
$8,120 |
$324,800 |
|
|
Contra Costa |
29 |
27 |
28 |
r |
$875,000 |
$5,570 |
$222,800 |
|
|
Marin |
24 |
23 |
25 |
r |
$1,700,000 |
$10,830 |
$433,200 |
|
|
Napa |
22 |
23 |
22 |
r |
$900,000 |
$5,730 |
$229,200 |
|
|
San Francisco |
19 |
18 |
23 |
r |
$2,000,000 |
$12,740 |
$509,600 |
|
|
San Mateo |
19 |
18 |
19 |
r |
$2,270,000 |
$14,460 |
$578,400 |
|
|
Santa Clara |
23 |
22 |
22 |
r |
$1,920,000 |
$12,230 |
$489,200 |
|
|
Solano |
33 |
33 |
29 |
r |
$590,000 |
$3,760 |
$150,400 |
|
|
Sonoma |
22 |
21 |
21 |
r |
$833,000 |
$5,300 |
$212,000 |
|
|
Southern California |
||||||||
|
Imperial |
30 |
29 |
25 |
r |
$420,000 |
$2,670 |
$106,800 |
|
|
Los Angeles |
15 |
17 |
14 |
r |
$958,450 |
$6,100 |
$244,000 |
|
|
Orange |
15 |
15 |
15 |
r |
$1,470,000 |
$9,360 |
$374,400 |
|
|
Riverside |
27 |
28 |
28 |
r |
$632,990 |
$4,030 |
$161,200 |
|
|
San Bernardino |
33 |
34 |
32 |
r |
$514,390 |
$3,280 |
$131,200 |
|
|
San Diego |
16 |
17 |
17 |
r |
$1,075,000 |
$6,850 |
$274,000 |
|
|
Ventura |
19 |
19 |
19 |
r |
$940,000 |
$5,990 |
$239,600 |
|
|
Central Coast |
||||||||
|
Monterey |
13 |
12 |
11 |
r |
$939,750 |
$5,980 |
$239,200 |
|
|
San Luis Obispo |
15 |
16 |
17 |
r |
$950,000 |
$6,050 |
$242,000 |
|
|
Santa Barbara |
12 |
12 |
13 |
r |
$1,240,000 |
$7,900 |
$316,000 |
|
|
Santa Cruz |
16 |
16 |
15 |
r |
$1,305,000 |
$8,310 |
$332,400 |
|
|
Central Valley |
||||||||
|
Fresno |
34 |
36 |
34 |
r |
$435,000 |
$2,770 |
$110,800 |
|
|
Glenn |
35 |
43 |
37 |
$420,000 |
$2,670 |
$106,800 |
||
|
Kern |
36 |
37 |
37 |
r |
$411,000 |
$2,620 |
$104,800 |
|
|
Kings |
35 |
37 |
41 |
r |
$383,800 |
$2,440 |
$97,600 |
|
|
Madera |
32 |
35 |
35 |
r |
$449,000 |
$2,860 |
$114,400 |
|
|
Merced |
29 |
31 |
30 |
r |
$420,000 |
$2,670 |
$106,800 |
|
|
Placer |
33 |
34 |
32 |
r |
$685,000 |
$4,360 |
$174,400 |
|
|
Sacramento |
33 |
32 |
32 |
r |
$549,990 |
$3,500 |
$140,000 |
|
|
San Benito |
23 |
24 |
23 |
r |
$803,600 |
$5,120 |
$204,800 |
|
|
San Joaquin |
32 |
32 |
31 |
r |
$555,000 |
$3,530 |
$141,200 |
|
|
Stanislaus |
33 |
32 |
30 |
r |
$485,000 |
$3,090 |
$123,600 |
|
|
Tulare |
37 |
39 |
39 |
r |
$396,500 |
$2,520 |
$100,800 |
|
|
Far North |
||||||||
|
Butte |
28 |
26 |
23 |
r |
$445,000 |
$2,830 |
$113,200 |
|
|
Lassen |
61 |
49 |
r |
52 |
$220,000 |
$1,400 |
$56,000 |
|
|
Plumas |
22 |
23 |
30 |
$545,000 |
$3,470 |
$138,800 |
||
|
Shasta |
40 |
41 |
38 |
r |
$395,000 |
$2,520 |
$100,800 |
|
|
Siskiyou |
40 |
37 |
35 |
$315,000 |
$2,010 |
$80,400 |
||
|
Tehama |
39 |
35 |
r |
37 |
r |
$315,000 |
$2,010 |
$80,400 |
|
Trinity |
43 |
30 |
34 |
$270,000 |
$1,720 |
$68,800 |
||
|
Other Calif. Counties |
||||||||
|
Amador |
39 |
39 |
36 |
$446,750 |
$2,840 |
$113,600 |
||
|
Calaveras |
37 |
33 |
34 |
$459,500 |
$2,930 |
$117,200 |
||
|
Del Norte |
35 |
35 |
34 |
$425,000 |
$2,710 |
$108,400 |
||
|
El Dorado |
33 |
34 |
36 |
r |
$698,500 |
$4,450 |
$178,000 |
|
|
Humboldt |
28 |
27 |
25 |
$430,000 |
$2,740 |
$109,600 |
||
|
Lake |
38 |
31 |
22 |
r |
$320,000 |
$2,040 |
$81,600 |
|
|
Mariposa |
39 |
27 |
29 |
$370,000 |
$2,360 |
$94,400 |
||
|
Mendocino |
24 |
25 |
30 |
r |
$525,000 |
$3,340 |
$133,600 |
|
|
Mono |
8 |
6 |
7 |
$1,399,000 |
$8,910 |
$356,400 |
||
|
Nevada |
35 |
31 |
38 |
r |
$550,000 |
$3,500 |
$140,000 |
|
|
Sutter |
34 |
35 |
37 |
r |
$449,500 |
$2,860 |
$114,400 |
|
|
Tuolumne |
42 |
40 |
36 |
$390,000 |
$2,480 |
$99,200 |
||
|
Yolo |
29 |
27 |
28 |
r |
$640,000 |
$4,080 |
$163,200 |
|
|
Yuba |
35 |
37 |
38 |
r |
$457,000 |
$2,910 |
$116,400 |
|
r = revised
Traditional Housing Affordability Indices (HAI) were calculated based on the following effective composite interest rates: 6.80% (3Qtr. 2026), 6.54% (2Qtr. 2025) and 6.67% (3Qtr. 2025).

 View original content to download multimedia:https://www.prnewswire.com/news-releases/california-housing-affordability-holds-steady-in-third-quarter-2026-as-lower-home-prices-offset-higher-mortgage-rates-car-reports-302925012.html
SOURCE CALIFORNIA ASSOCIATION OF REALTORS® (C.A.R.)

Distributed by PR Newswire / Cision.